As some of you know I am a member of Lehigh University’s premier student Investment Portfolio, the Dreyfus Portfolio. One of our responsibilities is to write a year-end report in May to the CIO of our school’s endowment. It is my second year being a part of this process and it’s a bittersweet one. We get to talk about the wins we have had and the knowledge that we have gained, but it is also one of the last times we work with the members who are seniors. This year I got to write the US Macro Outlook and Strategy. In honesty, it was me listing out my thoughts and my friend, who is now at Credit Suisse, introducing grammar into my writing.
To offer some trade recommendations from the writings below:
Trump mean reversion trade: Pair trade of Long KSU and short CAT
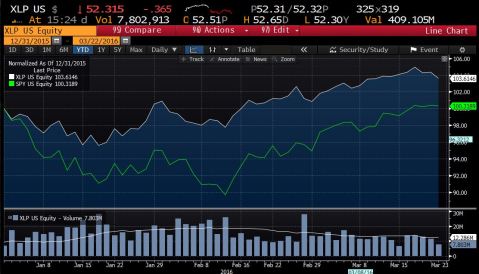
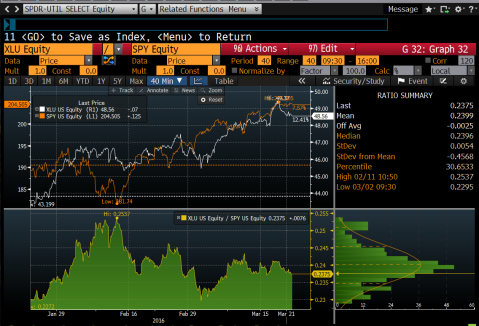
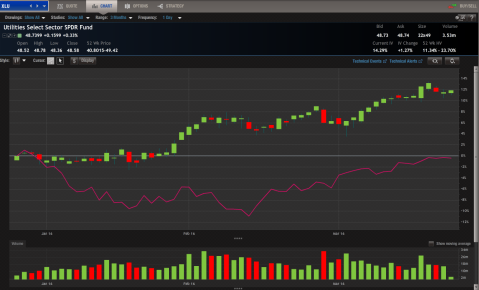
Shifting of weights by sector: Long XLE, XLU, IYZ
Raising of interest rates: JQC
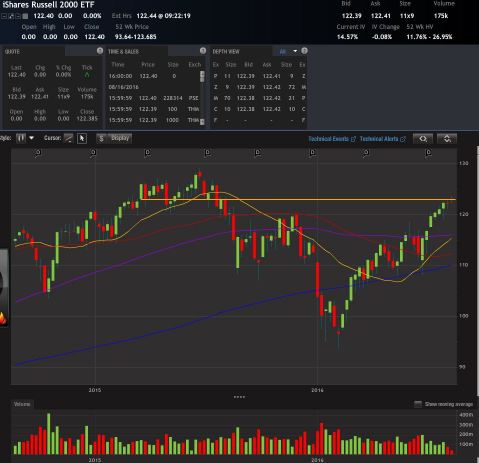
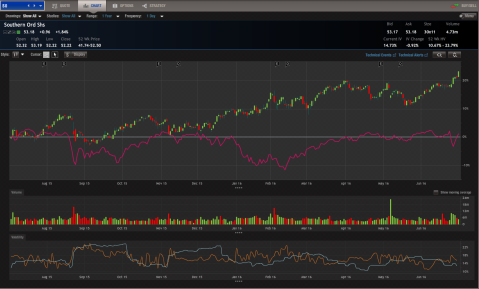
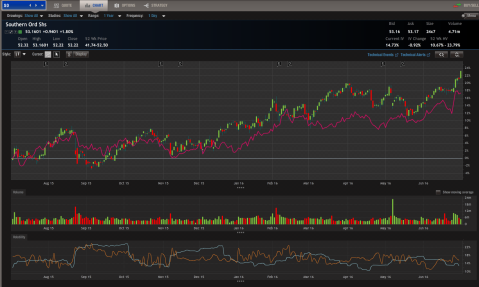
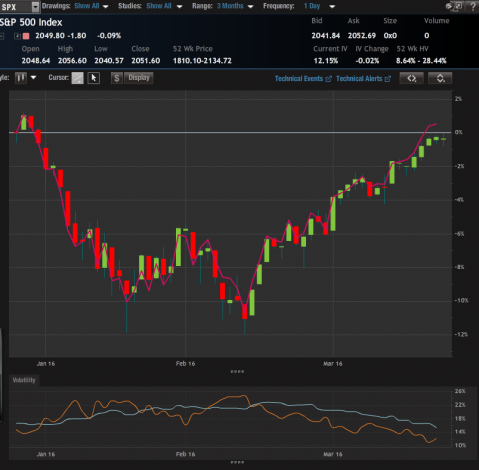
Large caps beating small caps: pair trade of Long SPY and short IWM
US Macro
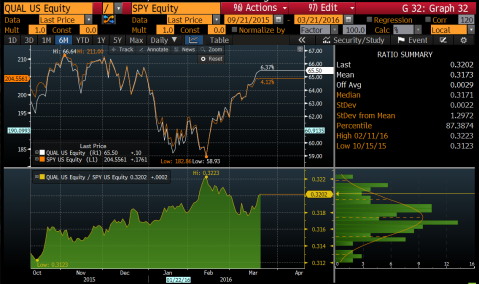
The US Macro Outlook has experienced large swings over our portfolio calendar year, from August 2016 through May 2017. Political and economic factors, overall uncertainty as well as have all impacted the investment strategy we have followed. 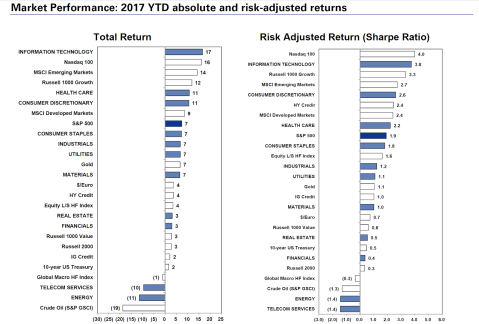 Cross Asset returns, Goldman Sachs Equity Research
Politics
In terms of politics, November 2016 had one of the most debated and unexpected American presidential elections. Donald Trump’s victory and the lack of future guidance regarding policies to come in his administration were reflected in market volatility. Trump made many ambitious campaign statements such as bringing back jobs to America, ending the USA’s involvement in NAFTA and NATO, building a wall on the Mexico border, and getting rid of Obamacare. However, his ability and willingness to act on his words remain to be fully proven.
The first 100 days of Trump in office are indicative a mean reversal trend across many sectors. Many swings that have occurred in the market regarding healthcare and tax reform have shown that the market is overly pessimistic and optimistic. The Board expects a mean reversion across other sectors that have been excessively lauded or, on the other hand, avoided.
Economics
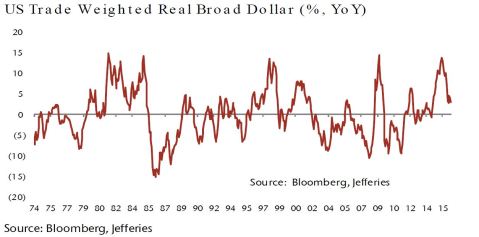
The economic outlook has been tied heavily to the Federal Reserve’s activities. The Board agrees with a market consensus of one or two more interest rate hikes in 2017. The US dollar is expected to stay strong regardless of the political agenda of decreasing trade deficits. While the administration is enticing American companies to bring home their operations, it is unclear whether they will adhere, and if so, to what extent. Numerous CEOs of international companies, for example, Nike, have commented that it is economically disadvantageous for them to relocate their operations. The long-term trends and implications are currently not clear, due in part also to market noise.
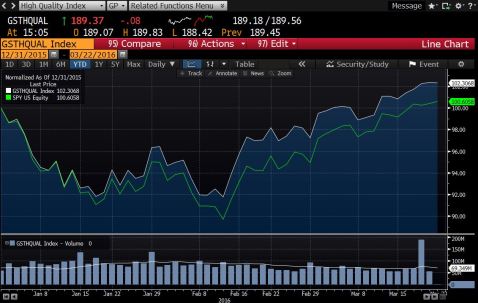
Employment remains a strong indicator for the economy and the Fed’s plan of action. While the market is focused predominantly on the U3 unemployment calculation method, the data from the U6 shows that there is still a lot of slack presents and the economy is not at full employment. 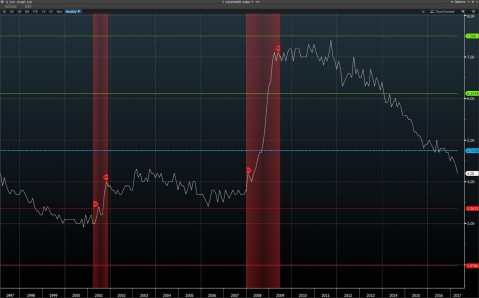 U6-U3 with fixed standard deviations and Recessions marked.
The Federal Reserve also plans to start selling off the assets is has acquired during quantitative easing. The Fed is expected to start selling its mortgage-backed securities in September, followed by treasuries later down the road, proceeding from the least liquid of its assets.
Strategy
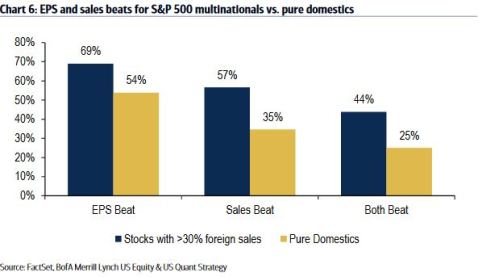
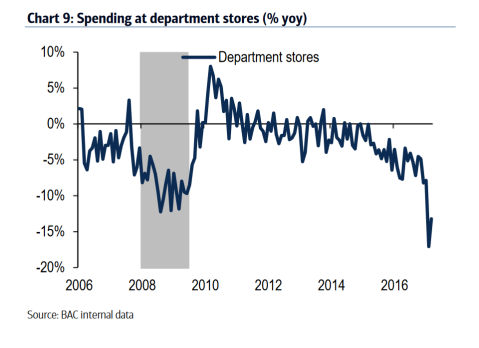
The Board believes that several sectors are due to outperform in the upcoming year. We expect a shift in currently underweight sectors, such as Energy, Telecom, and Utilities, to overweight. On the other hand, Technology which has had a very strong rally, is anticipated to become underweight. The Retail sector remains problematic with more large-scale bankruptcies on the horizon. The discussed upcoming reduction in FCC regulation is indicative of many M&A transactions within the media and telecom sector. The industrial and energy companies, specifically, large cap companies with big offshore cash piles, are expected to repatriate assets.
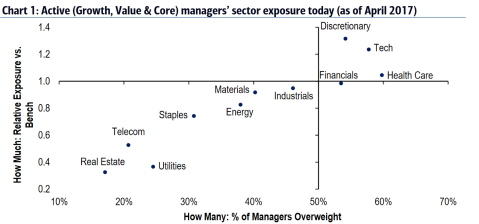 Manager Exposure, Bank of America Merrill Lynch Quantitative Equity Research
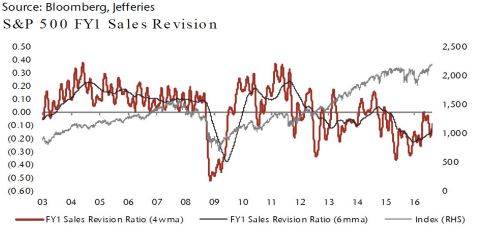
Small cap companies are historically more directly affected by GDP growth, which remains moderate in the US. They have underperformed large cap firms which have a stronger global presence and have benefited from the strong dollar. The first two-quarters of 2017 have shows strong corporate profits and low guidance revision ratios, forecasting a good second half of the year.
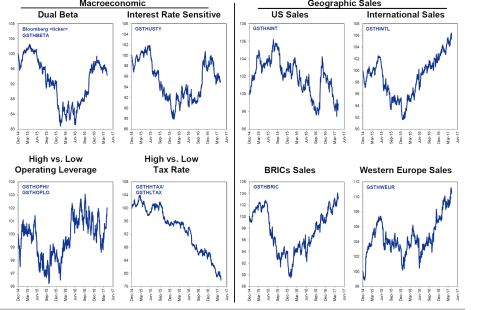 Cross Asset returns, Goldman Sachs Equity Research